
This post was originally written in Turkish and translated into English with AI.
Since the 2023 election, investors in Turkey have found themselves in a regime they had not seen for a long time. With the tight monetary policy framed as ‘orthodox’ policy, capital became constrained and there was a jump in all asset prices and in expected returns. While many investors welcomed this as part of the improvement that normalisation brings, it only showed up in prices after the destruction left behind by the capacity expansion of earlier periods. Many of us lived through this by delivering poor performance in markets where the opportunity cost kept rising.
Another way to minimise the loss here was VIOP, Borsa Istanbul’s derivatives market. Thanks to their capital-light structure, derivatives offered investors a way to trade that was both cheap and expensive. Stocks that could not beat the alternative lira return offered a high carry to those holding short positions.
In this piece, unlike the earlier ones, we will look together at how the futures market behaves in the orthodox regime and build a model that produces scores. We will then turn to the implications of these scores for the market and examine the dynamics of a long/short portfolio.
Building the Model
Because of short-selling bans, the investable universe in the Turkish market is often narrow and investors need to use the VIOP market. We therefore have to keep our investable universe within that frame. Here we will be evaluating the 33 industrial and services stocks that have single-stock futures contracts. Banks and holding companies are left out of the scoring because they are not comparable sectors.
The scoring has two parameters in total:
Parameter 1: We look at how many standard deviations four multiples (Forward P/E, Forward EV/EBITDA, Forward EV/Sales, Trailing EV/EBITDA) sit from their own weekly average over the last two years, and turn this into a composite z-score. In short, this parameter scores where the company’s valuation stands relative to its own history.
Parameter 2: The stock is compared with its own sub-sector (retail, aviation, iron and steel, etc.) and its percentile is calculated for the four multiples mentioned above. This produces the second, alternative score, which measures how expensive the stock is within its sector.
In addition, there are some limits we set so that names can be screened out:
- Consensus data for at least two of the multiples is not available from the data provider
- Loss-making companies, and those with astronomical P/E figures because of low earnings, are not included in the calculation
- Forward estimates are built from median items. Stocks without up-to-date estimates are screened out
Because of the narrow pool of companies on Borsa Istanbul and the gaps in estimates, an average of 25 companies make it into our tradable universe. Parameters 1 and 2 will be weighted 75% and 25% respectively. The reason is that, while we want to test stocks against their own historical valuations, we do not want to ignore the positive valuation effects that can occur at the sector level.
After all this, as an example, you can find the sample ranking for 26 June 2026 below. There are some nuances in the table that deserve attention; I will come back to them when we reach the performance section.
| # | Ticker | Parameter 1 75% · own history, SD | Parameter 2 25% · group rank, scaled | Composite score | Basket | Weeks in basket |
|---|---|---|---|---|---|---|
| 1 | EREGL | +3.37 | +1.18 | +2.83 | Expensive 25% | 3 |
| 2 | PETKM | +1.90 | +1.25 | +1.74 | Expensive 25% | 15 |
| 3 | ARCLK | +1.90 | +0.24 | +1.49 | Expensive 25% | 3 |
| 4 | KRDMD | +1.60 | +0.90 | +1.42 | Expensive 25% | 11 |
| 5 | DOAS | +1.83 | −0.93 | +1.14 | Expensive 25% | 3 |
| 6 | AKSEN | +0.99 | +0.96 | +0.98 | Expensive 25% | 32 |
| 7 | ASELS | +0.62 | +1.88 | +0.93 | ||
| 8 | THYAO | +1.18 | −0.79 | +0.69 | ||
| 9 | CIMSA | +0.61 | +0.56 | +0.60 | ||
| 10 | TOASO | +0.45 | +0.26 | +0.40 | ||
| 11 | TAVHL | +0.36 | +0.47 | +0.39 | ||
| 12 | AEFES | +0.72 | −1.07 | +0.27 | ||
| 13 | MGROS | +0.21 | −1.00 | −0.09 | ||
| 14 | BIMAS | −0.26 | +0.34 | −0.11 | ||
| 15 | ENJSA | −0.02 | −0.43 | −0.12 | ||
| 16 | TRALT | −0.41 | +0.71 | −0.13 | ||
| 17 | TUPRS | −0.01 | −1.02 | −0.26 | ||
| 18 | TCELL | −0.11 | −0.89 | −0.30 | ||
| 19 | ENKAI | −0.66 | +0.61 | −0.35 | Cheap 25% | 1 |
| 20 | SOKM | −0.21 | −1.38 | −0.50 | Cheap 25% | 32 |
| 21 | PGSUS | −0.88 | −0.29 | −0.73 | Cheap 25% | 38 |
| 22 | FROTO | −0.76 | −0.63 | −0.73 | Cheap 25% | 11 |
| 23 | ULKER | −0.89 | −1.28 | −0.99 | Cheap 25% | 3 |
| 24 | TTKOM | −1.12 | −1.25 | −1.15 | Cheap 25% | 3 |
Composite = 75% × Parameter 1 + 25% × Parameter 2. Parameter 2 is the percentile within the sub-sector group, mapped from −2 (cheapest) to +2 (most expensive). No score this week: ASTOR, BRSAN, GUBRF, ODAS, OYAKC, SISE, TKFEN, TRMET, VESTL. Source: EquityRT, Bloomberg.
Model Performance & Backtest
First I should point this out: looking at the statistical metrics, our model’s t-stat is 0.38, so although the performance is good in nominal terms, we have no evidence that it is sustainable. The main reason is that we are testing over a short time span and in a specific regime. Since we look at a weekly rebalance, we have 210 windows, and that is not enough to produce a statistically meaningful result.
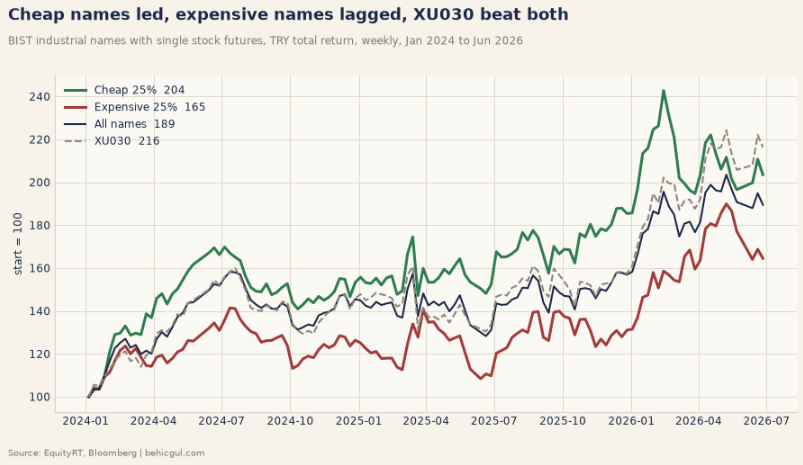
Looking at the details, we observe that the cheap group outperformed the expensive group. I have also included the XU030 index for comparison, but it is worth remembering that it contains banking and holding stocks.
| Year | ExpensiveExp. 25% | All names | Cheap 25% | XU030 | Cheap less expensiveexp. |
|---|---|---|---|---|---|
| 2024 | +25.1% | +44.9% | +55.8% | +47.8% | +30.7% |
| 2025 | +5.1% | +9.2% | +19.2% | +9.0% | +14.1% |
| 2026 (first half)H1 | +25.1% | +19.7% | +9.6% | +34.2% | −15.5% |
Baskets are formed at the weekly close and held for one week at equal weight. Period: January 2024 - June 2026. Source: EquityRT, Bloomberg.
We observe that the trend that ran until 2026 reversed in the first half of the year. To touch on the main reasons:
- Analyst estimates for richly priced stocks such as ASELS and TUPRS lagging behind puts these stocks into the expensive category, but once results come in, multiple expectations normalise with analyst revisions
- Some stocks stay in the cheap category for a very long time, consuming capital and time. In names such as PGSUS, SOKM and ULKER, company-specific reasons prevent a re-pricing.
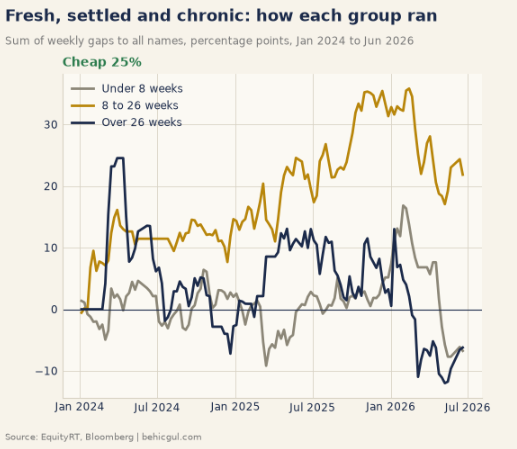
- The real re-rating happens not in stocks that have sat in the expensive and cheap groups for a long time but in those that have newly entered these groups, and the pricing is largely complete within 3 to 6 months on average.
In the chart below you can see in which time range the returns are concentrated.
Feasibility & the Weekday Effect
All the charts you have seen above are in principle built on Friday closing prices and without trading costs. When building the model, it matters to look at its feasibility and at how often we need to update the names. If we take the group we analysed as our benchmark, it turns over roughly 16x a year, and with an average rollover risk of 30 bps the strategy can no longer generate alpha (futures contracts expire on a set date, so an investor who wants to keep the position has to close the old contract and open the new one; rollover risk is the erosion of return by the price difference between the two contracts and by the transaction cost in that switch).
| Basket | Cheap 25% | Expensive 25% |
|---|---|---|
| Replaced a week | 15% | 14% |
| Average stay (weeks) | 6.6 | 7.0 |
| Capital traded a year | 16x | 15x |
| Gap to all names, a year | +4.1% | −5.3% |
| Break-even cost a trade | 26 bp | 35 bp |
Break-even cost: the gap to all names divided by the capital traded a year; a trade is one buy or one sell. Gaps are arithmetic (average weekly gap times 52). Source: EquityRT, Bloomberg.
Looking at the weekday effect, we see that Thursday in particular produces a statistically demonstrable positive return on the exchange. So moving our rebalance day to Wednesday evening, although it may create different problems, emerges as an important criterion for generating alpha.
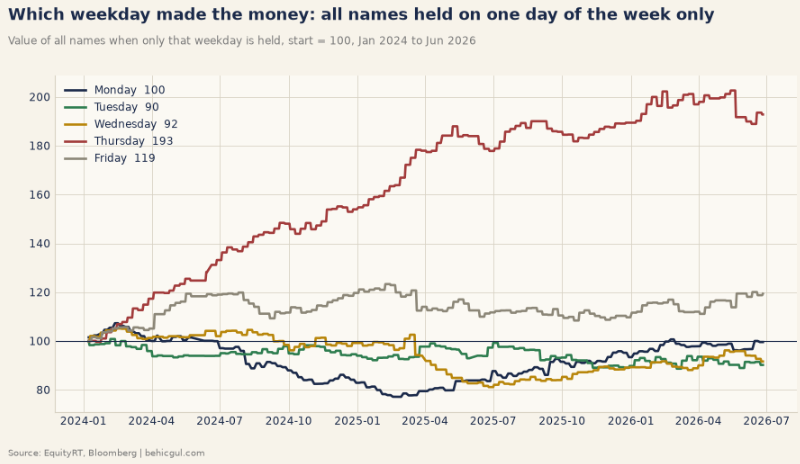
| Day | Share of days up | Cheap beat expensiveexp. | t statistic | ||||
|---|---|---|---|---|---|---|---|
| Cheap 25% | ExpensiveExp. 25% | All names | XU030 | All names | Cheap less exp.− exp. | ||
| MondayMon | 46% | 52% | 50% | 50% | 49% | +0.1 | −1.1 |
| TuesdayTue | 44% | 51% | 43% | 45% | 52% | −0.6 | +0.2 |
| WednesdayWed | 50% | 52% | 46% | 49% | 53% | −0.5 | +1.1 |
| ThursdayThu | 66% | 64% | 69% | 66% | 56% | +4.5 | +1.4 |
| FridayFri | 53% | 51% | 59% | 53% | 50% | +1.1 | +0.1 |
| All daysAll | 52% | 54% | 53% | 52% | 52% | +1.9 | +0.7 |
Daily returns are close to close: Monday is Friday's close to Monday's close. t stat: average daily return over its standard error; about 2 or more in size is a reliable difference from zero. Source: EquityRT, Bloomberg.
Closing
In this piece I wanted to touch briefly on a kind of modelling that can be done with a limited data set. Micro models of this sort can later be combined with different structures and turned into systems that generate reasonable returns.
Even when they cannot, the ability to screen different companies quickly saves the portfolio manager time by allowing a fast evaluation of companies and a focus in the right direction. If you have read this far without getting bored, thank you; see you in the next piece.
Disclaimer
This post has been prepared for informational purposes only and does not constitute investment advice, a recommendation to buy or sell, or an offer relating to any security. The views and analyses expressed here reflect the author’s personal assessments and do not represent the official view of any institution he is affiliated with. The author may hold positions in the securities mentioned in this post. Past performance is no guarantee of future results. Every investment carries risk; investors should do their own research and consult a licensed investment advisor where necessary.