This post was originally written in Turkish and translated into English with AI.
In this piece we’ll take a look at one of the most popular sectors of the moment: neoclouds. We’ll examine these companies’ leveraged business models, look at why the megawatt figures they share can be misleading, and then dig into two companies in the same sector reporting completely opposite results.
The Neocloud Business Model
Neoclouds are purpose-built, GPU-centric cloud providers. They rent out compute power, and they do so almost exclusively with NVIDIA GPUs. These GPU systems, interconnected at massive scale, are used to train and run AI models. The difference from cloud services like AWS/Azure/Google Cloud is that those systems serve a far broader set of use cases. Hyperscaler clouds are widely used on the retail side for all sorts of purposes (SKUs, databases, web hosting, IoT, email), whereas neocloud firms offer an AI package specialized in one thing—both in hardware and in software.
In business-model terms, neocloud firms sit at the very end of the value chain, with the most volatile revenue-and-margin profile in the sector. Construction and electrical infrastructure companies collect their payments upfront and step aside, offering a predictable scenario. NVIDIA likewise uses its monopoly position to control market supply and secure a stable revenue stream. Neocloud firms, by contrast, appear exactly when capacity runs short and benefit from the heat of competition in the market. Especially with the recent surge in open-source models, demand for compute has grown parabolically. In this period of constrained access to compute, neocloud companies have become hugely popular names for investors and users alike.
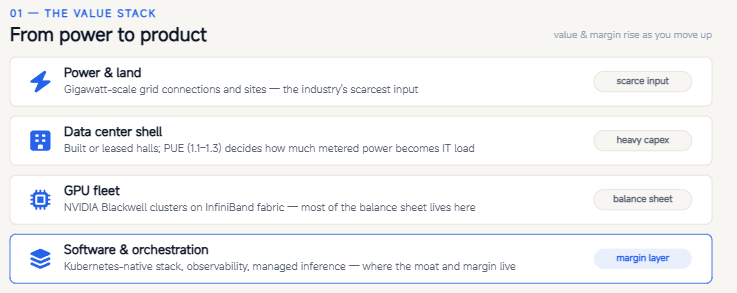
Bitcoin miners like IREN in particular made a fast entry into this sector thanks to their pre-built complexes, power infrastructure, and GPUs. Having built expertise in two different sectors, these companies maximize GPU operating hours by switching between neocloud work and BTC mining as needed.
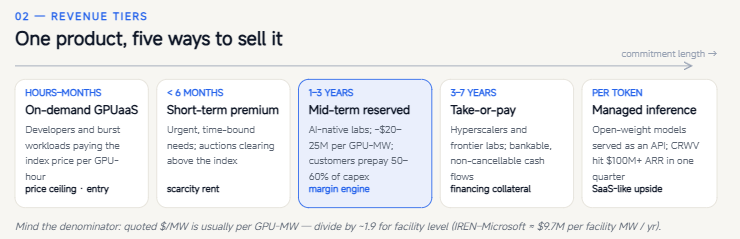
These firms price differently by tenor, and while margins rise as the term shortens, 1-3 year contracts remain their preferred duration to avoid idle GPUs. In addition, the “per-token” pricing model—a revenue model I also discussed in my software-sector piece—lets customers spend independently of any contract term.
The Megawatt Illusion
When companies tell investors “we’re building a 300 MW AI data center,” they are actually talking about the utility meter: the total power the complex draws. Only a portion of that power turns into revenue-generating, billable GPU-hours. Let’s walk step by step through how the power drawn by a data center becomes revenue.
Stage 1: PUE (Power Usage Effectiveness). PUE = Total Facility Power / IT Power. It is the ratio that strips out cooling, power-distribution losses, UPS, lighting, and security overhead. Google runs the industry’s most efficient PUE (1.09), while a new, high-end data center averages a 1.1-1.2 PUE band. A data center with a 1.25 PUE, for instance, can convert only 80% of the complex’s MW capacity into IT load to pass on to the next stage.
Stage 2: The GPU’s share of IT load. Not all of the MW capacity that reaches IT load belongs to GPUs. A GB200/NVL72-class system (NVIDIA’s massive liquid-cooled AI system design containing 36 Grace CPUs and 72 Blackwell GPUs) also includes DRAM, NVLink, NAND, CPU nodes, and an elaborate cabling network. In this layout, GPUs can use roughly 55%-65% of the system’s power.
Stage 3: Utilization and term. As part of the business model, current GPU rental prices and the details of long-term agreements shape pricing. A customer with an urgent need for GPU power may pay above the index price, while long-term deals struck by hyperscalers are priced at a much lower $/GPU-hour. Here we can take the sector’s average utilization as 85%. Figures above that are usually earned from the urgent-need customers I mentioned.
The GPU Market
Before turning to the companies, I want to briefly touch on the compute market being built under the leadership of silicondata. According to CNBC, compute is becoming a hedgeable asset class like oil and electricity; for the first time, the market is getting a public, tradeable reference price for GPUs—the resource every AI system runs on. The layer we actually care about is the infrastructure side, because a listed forward curve has three important consequences. First, it gives GPU-collateralized lenders a basis hedge and can compress financing spreads over time. Second, it produces the sector’s most critical missing input: a residual-value curve derived from market pricing, which tells you what the market thinks of GPUs assigned 5-6 year depreciation lives. Beyond that, it opens the door to index-linked floating rental contracts down the road. This market is still very small and illiquid, but its growth over time, turning hardware into financial instruments, is a development worth watching. I’ll come back later to Jensen Huang’s tweets on this subject and the details of the new financial instruments.
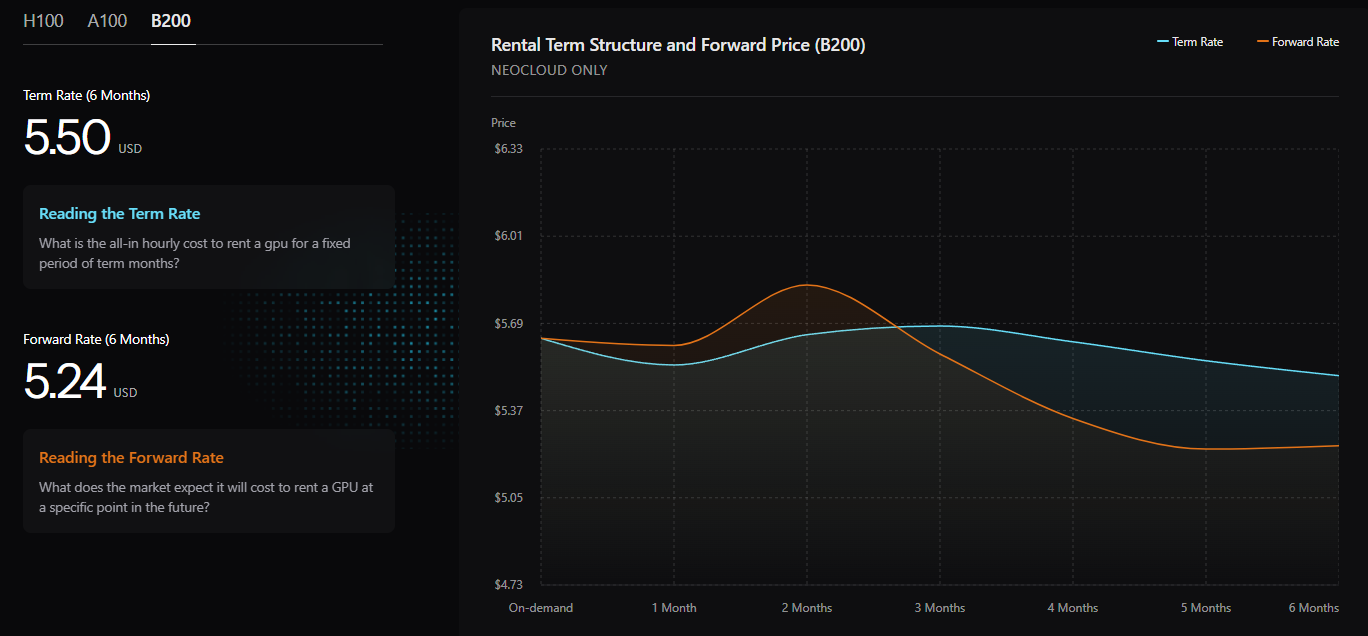
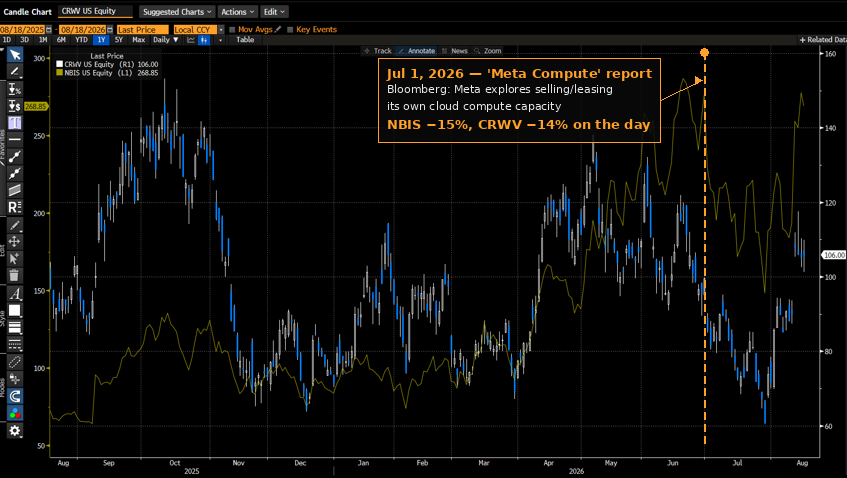
In the rest of this piece we’ll briefly cover Coreweave and Nebius and examine the results of these two players in the same sector. Before moving to the companies, to appreciate how fragile this business model is, let me show the impact of a single Bloomberg headline that landed at the end of June. On the news that Meta might sell its own cloud capacity, the companies’ shares fell -15% in a single day.
Coreweave
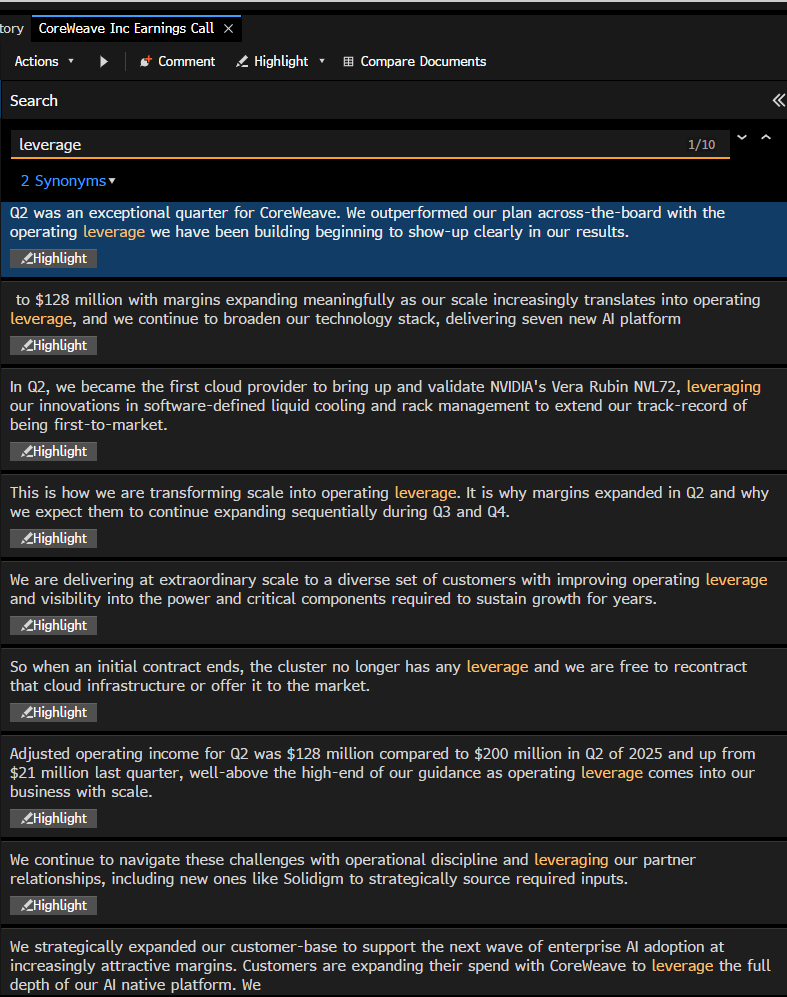
Looking at the results, we see the forward-looking story of a not-yet-profitable company being marketed by its CEO. The concept of “operating leverage,” repeated over and over on the latest earnings call, is nowhere to be seen despite growing sales. At many points in the call, numbers were described with adjectives instead of being shared. The company also does not disclose its PUE figures, while stating that it rented out A100 GPUs at “attractive” prices.
When we examine the numbers, we see that the company’s growing depreciation charges are seriously eroding margins, and that adjusted EBIT figures are pushed to the front. Let’s look together at how adjusted EBIT is calculated:
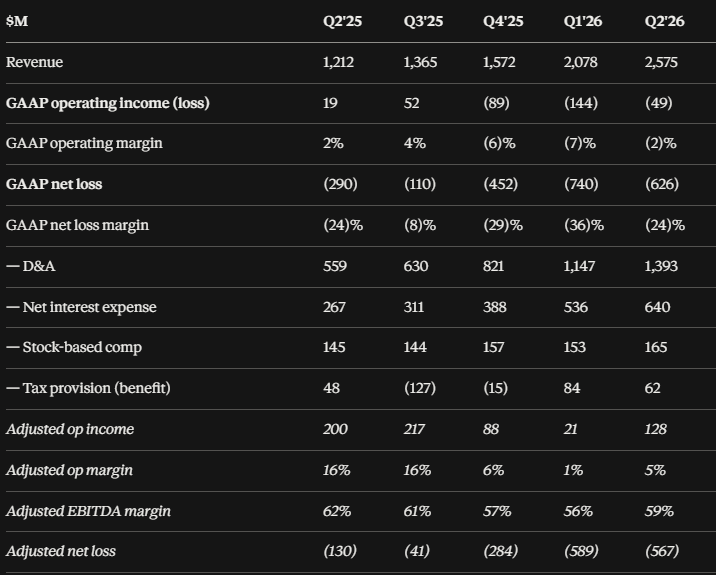
Adjusted EBIT = EBIT + D&A + Net Interest Expense + SBC (Share-Based Compensation) + Tax Provision
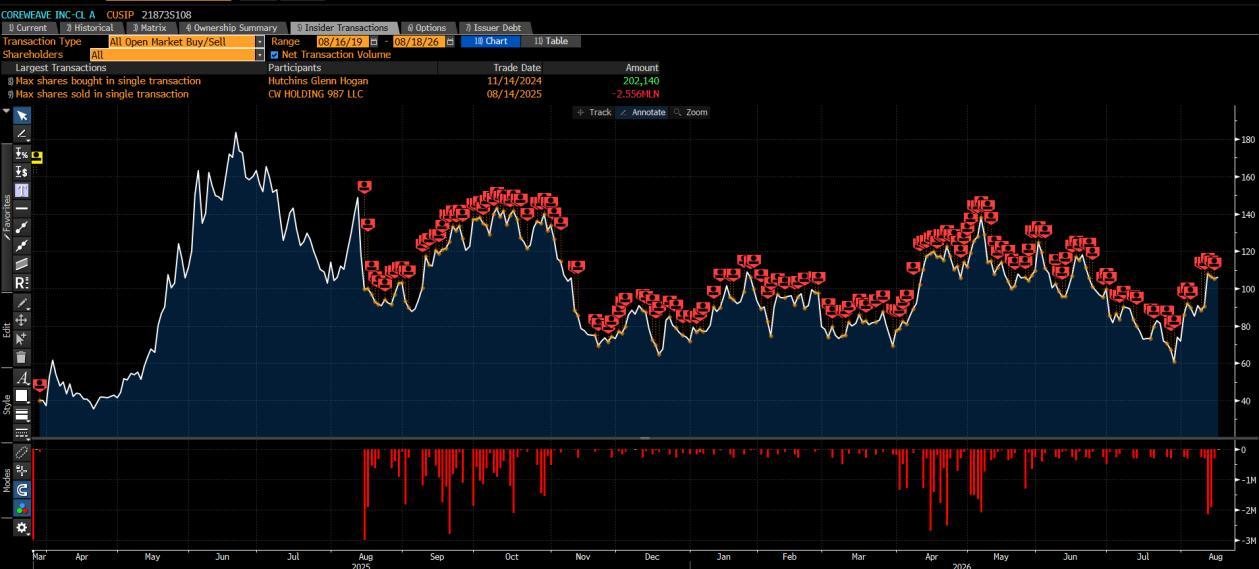
As you can see, the company adds back both depreciation and share-based payments to appear profitable. The biggest problem here is this: the D&A line consists of the most important part of the company’s business model—the GPUs. Consistently presenting the numbers this way means treating an item worth more than half of revenue as if it didn’t matter. The CRWV CEO must agree with us on this, because whenever the share price rises, the company steps up its share sales.
Nebius
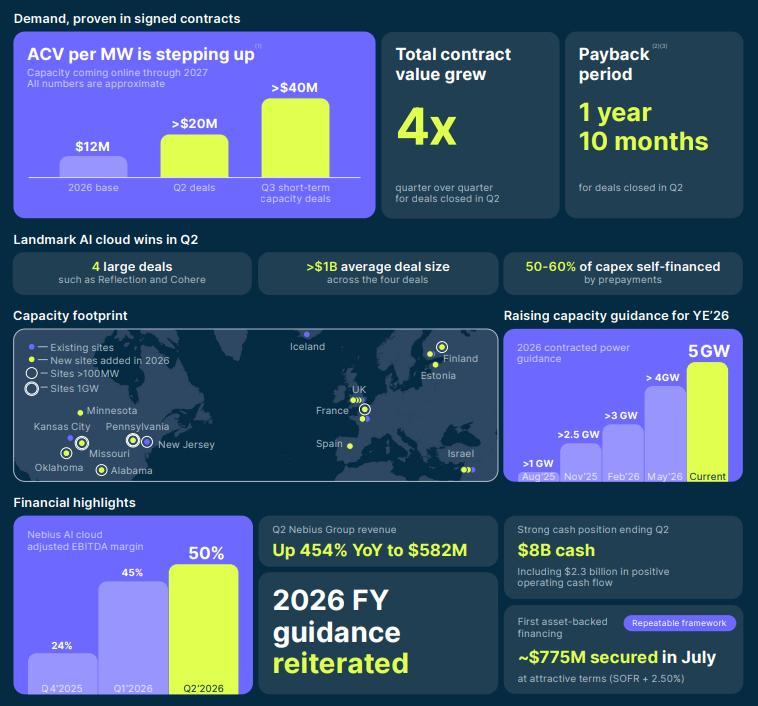
The company delivered a very strong performance, growing revenue 4.5x year over year, while ARR rose from a quarterly $1.9 billion to $3 billion as of the end of June. The company guides to $7-9 billion of ARR by year-end and stated that it collects 60-70% of its long-term agreements as prepayments, which will be applied to capex.
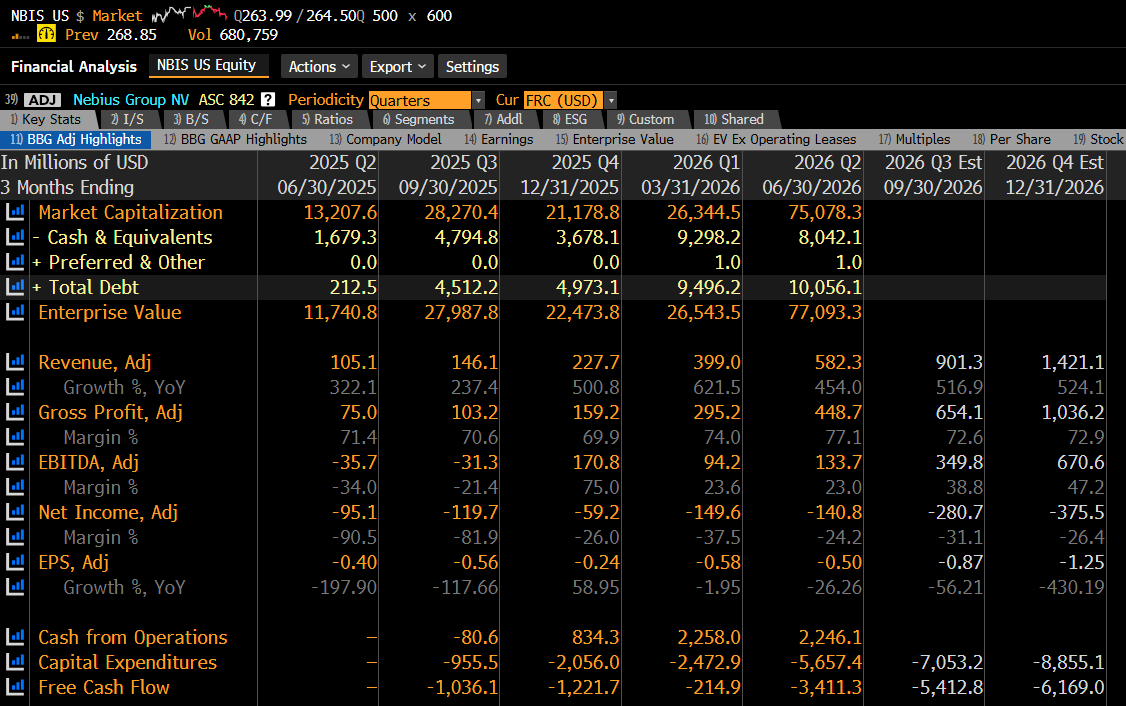
As for the points that deserve attention: although this is operationally a more transparent company, we fall into the same MW illusion I described earlier. When the company discloses its ACV-per-MW figures, it is talking about GPU power consumption. That makes the MW capacity look almost 2x inflated.
Another contentious issue concerns the company overstating its free cash flow. As I mentioned, nearly all of the prepayments go toward capex, yet the company books them under operating cash flow in its cash flow statement. Economically, this cash is not operations—it is financing. The customer is funding the capex of capacity that has not yet been built; in effect, it is extending Nebius a loan collateralized by future service delivery. GAAP puts this in CFO, but analytically it needs to be reclassified to CFF. Otherwise, today’s operating cash flow ends up funding tomorrow’s operating cash flow, which means lower cash conversion rates in the future.
Disclaimer
This post has been prepared for informational purposes only and does not constitute investment advice, a recommendation to buy or sell, or an offer relating to any security. The views and analyses expressed here reflect the author’s personal assessments and do not represent the official view of any institution he is affiliated with. The author may hold positions in the securities mentioned in this post. Past performance is no guarantee of future results. Every investment carries risk; investors should do their own research and consult a licensed investment advisor where necessary.